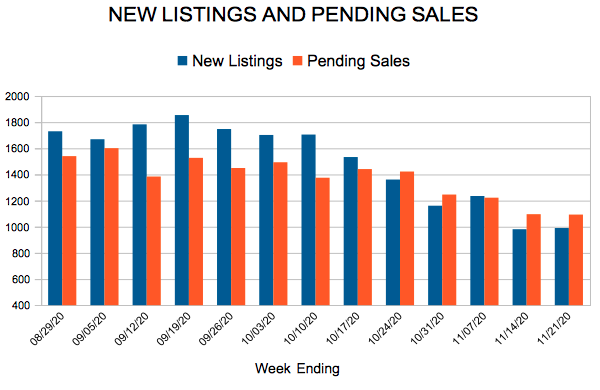
New Listings and Pending Sales
952-201-1991

New listings and sales up, price growth accelerating, but supply levels extremely low
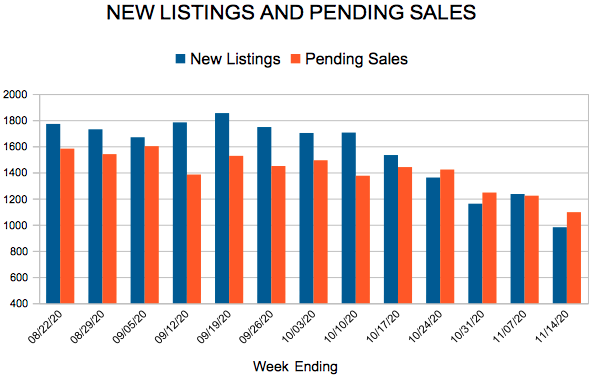
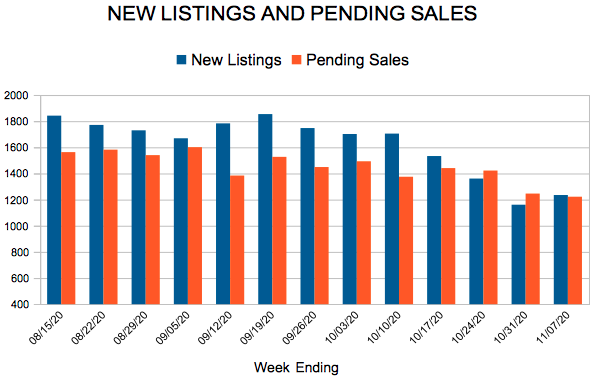
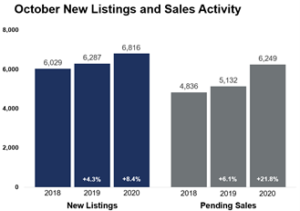
(November 19, 2020) – According to new data from the Minneapolis Area REALTORS® and the Saint Paul Area Association of REALTORS®, buyer and seller activity in the 16-county Twin Cities metro continue to outpace 2019. Seller activity rose 8.4 percent compared to last October while buyer activity was up 21.8 percent, marking the strongest October sales figure since at least 2003.
Buyers are motivated by expectations of working and spending more time at home and are also buoyed by historically low interest rates. That has resulted in a highly competitive marketplace where sellers get strong offers—sometimes above asking price—in record time and often with multiple offers. It has also caused inventory levels to plummet, frustrating many buyers.
“Buyers are still out in force, which is fairly unusual for this time of year when things typically quiet down,” according to Patrick Ruble, President of the Saint Paul Area Association of REALTORS®. “But the shortage of inventory and fast pace of the market are still keeping some waiting in the wings.”
Record-low mortgage rates, a desire for more space, a shortage of listings and Millennials aging into homeownership have all led to record-setting demand and rising prices among other changes. This is unusual during a recession, which impacts people differently. The mid-market move-up ranges and luxury segments have been performing better as salaried professionals have been spared much of the hardship. Conversely, many would-be buyers in the most affordable price points have been sidelined as they’re more likely to be impacted by job or income loss.
Still firmly in the driver’s seat, sellers, on average, accepted offers at 100.5 percent of their original list price—matching a high for any month going back to at least 2003. At 35 days on average, homes across the metro sold 23.9 percent quicker than last October.
“Despite some earlier challenges, Minneapolis and St. Paul are still seeing strong sales growth,” said Linda Rogers, President of Minneapolis Area REALTORS®. “They’re still quite competitive.”
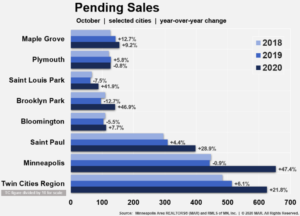
For example, new listings rose 35.5 percent in Minneapolis and 22.8 percent in St. Paul while sales were up 47.4 and 28.9 percent, respectively. Demand in the core cities is once again outpacing supply. Downtown condos are still an area of weakness, but metro-wide sales of homes priced over $1M are up over 98.0 percent from last October.
October 2020 by the numbers compared to a year ago
All information is according to the Minneapolis Area REALTORS® and Saint Paul Area Association of REALTORS based on data from NorthstarMLS. We serve the Twin Cities 16-county metro area and western Wisconsin.
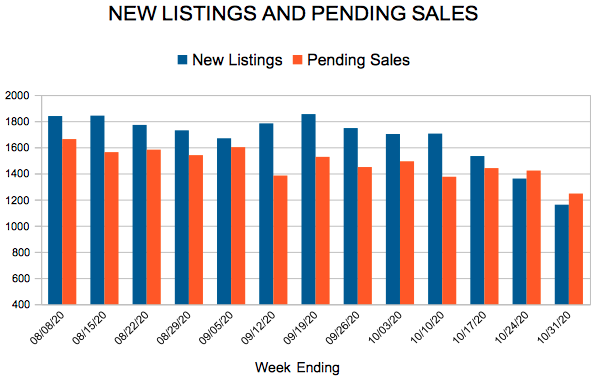
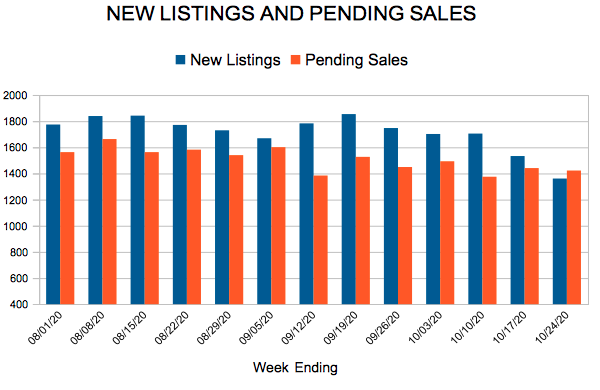
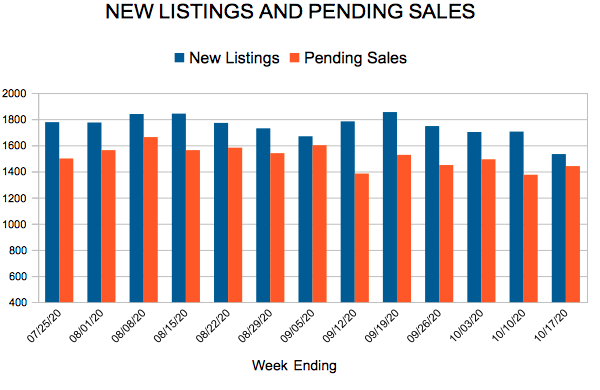
New listings and sales up, price growth strong, but supply levels wearing thin
(October 19, 2020) – According to new data from the Minneapolis Area REALTORS® and the Saint Paul Area Association of REALTORS®, buyer and seller activity in the 16-county Twin Cities metro both increased from 2019.
This summer and even early fall market continue to resemble more of a spring market. Although some activity from the 2nd quarter was shifted into the 3rd quarter, buyers more than made up for the lost time and continued to ink new records. Sales activity year-to-date is already above last year. Seller activity—while still lagging—made its largest gain since March.
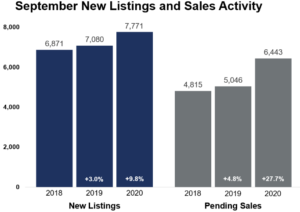
Specifically, pending sales rose 27.7 percent compared to last September to 6,443, marking at least an 18-year record high for the month going back to 2003. At 7,771, new listings were up 9.8 percent, which was the highest September since 2008.
“The demand out there in the market at this time of year is truly remarkable—especially during a pandemic,” according to Linda Rogers, President of Minneapolis Area REALTORS®. “Even though seller activity is on the rise, inventory levels remain extremely low, particularly in the affordable ranges. Serious buyers should be prepared to write strong offers quickly.”
While nothing about 2020 could be called predictable, one predictable outcome of historically strong housing demand and tight supply is rising prices. The metro-wide median sales price rose 10.8 percent to $310,000, the largest year-over-year gain since February 2018. The median sales price for new homes, however, rose 2.7 percent to $417,000 while existing home prices rose 11.1 percent to $300,000.
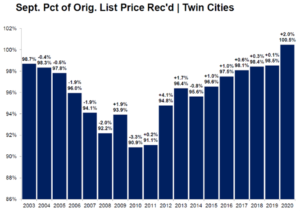
Multiple offer situations remain common as a large pool of buyers compete over a thinning stock of properties. Sellers, on average, accepted offers of 100.5 percent of their original list price—marking a new high for any month going back to at least 2003. A balanced market typically has 5-6 months of supply. At 1.7 months, sellers are still in the driver’s seat in most areas.
With such an imbalance in market forces, properties sold 31.8 percent faster than last year. Half the sales occurred in less than 15 days, tying with August for a 14-year record pace. “Even though activity is strong overall,” said Patrick Ruble, President of the Saint Paul Area Association of REALTORS®. “Every city, neighborhood, price range and property type are unique.”
For example, sales rose 41.4 percent in Minneapolis and 33.8 percent in St. Paul while new listings were up 47.8 and 17.7 percent, respectively. Seller activity in Minneapolis reached its highest level since 2007, while seller activity in the metro overall reached its highest level since 2008. The region’s condo market, however, saw new listings rise 28.9 percent while sales fell 2.6 percent. The metro condo market has 4.0 months of supply while that figure is 6.0 months in Minneapolis. Perhaps driven by attractive jumbo rates, sales of homes priced over $1M are up over 60.0 percent from last September.
September 2020 by the numbers compared to a year ago

Greet me and meet me on social media. You can follow my new listings and changes in the marketplace on any of the following. Follow me.


