September 29, 2022
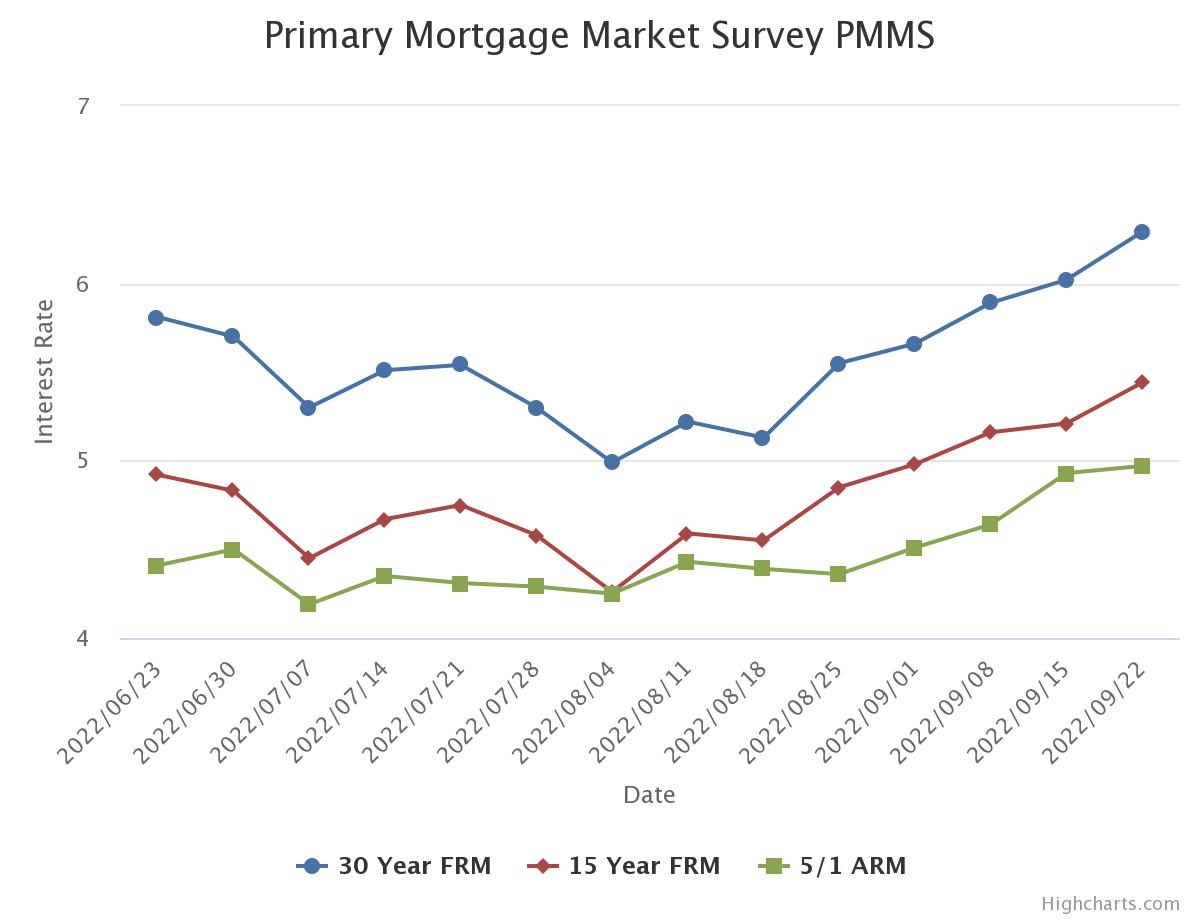
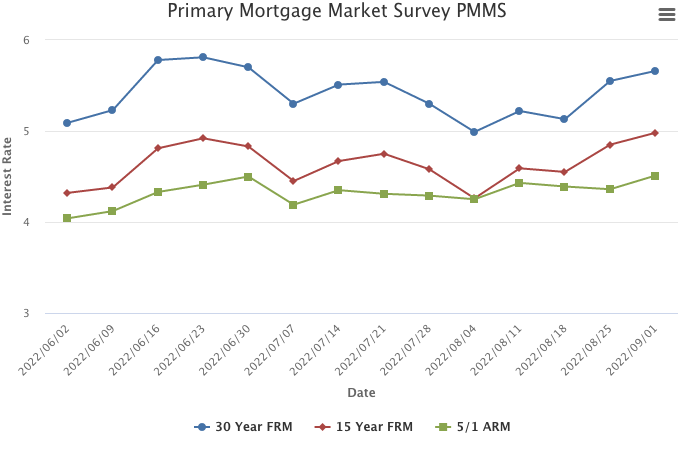
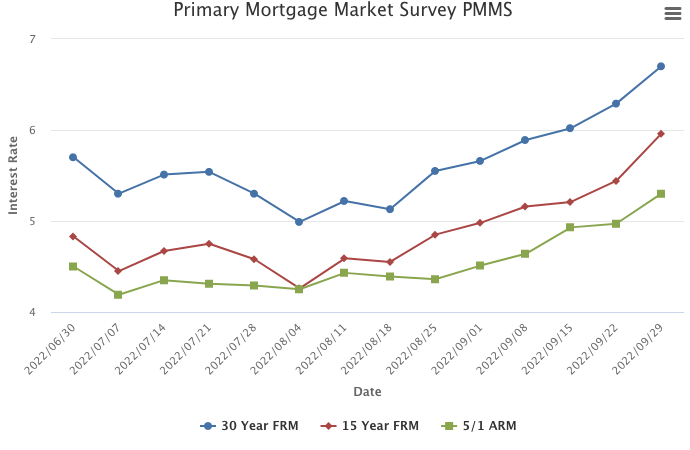
The uncertainty and volatility in financial markets is heavily impacting mortgage rates. Our survey indicates that the range of weekly rate quotes for the 30-year fixed-rate mortgage has more than doubled over the last year. This means that for the typical mortgage amount, a borrower who locked-in at the higher end of the range would pay several hundred dollars more than a borrower who locked-in at the lower end of the range. The large dispersion in rates means it has become even more important for homebuyers to shop around with different lenders.
Information provided by Freddie Mac.

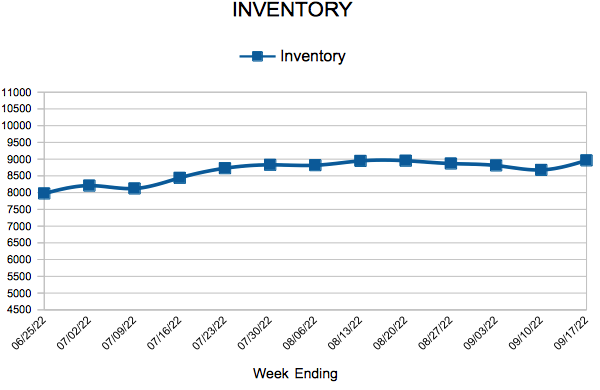
 For Week Ending September 17, 2022