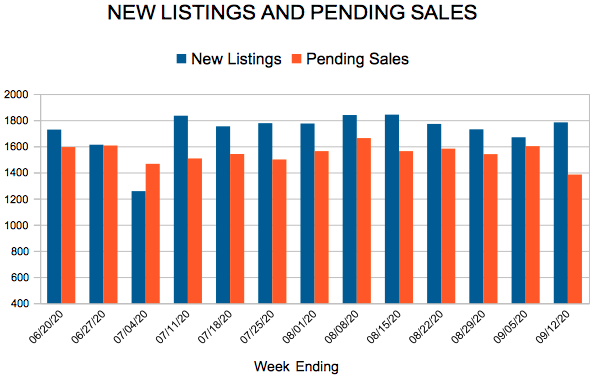
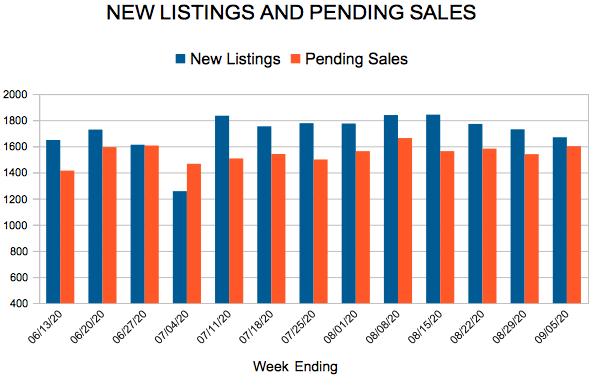
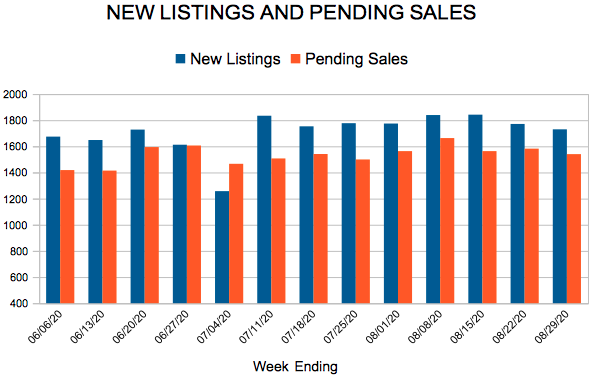
New Listings and Pending Sales

New listings and sales up, price growth strong, but some activity from Q2 was postponed into July/August
(September 18, 2020) – According to new data from the Minneapolis Area REALTORS® and the Saint Paul Area Association of REALTORS®, buyer and seller activity in the 16-county Twin Cities metro both increased from 2019.
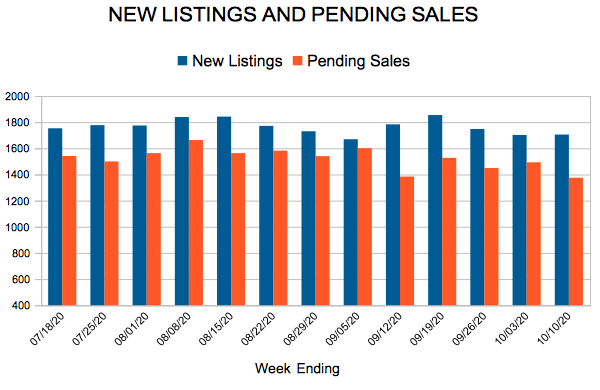
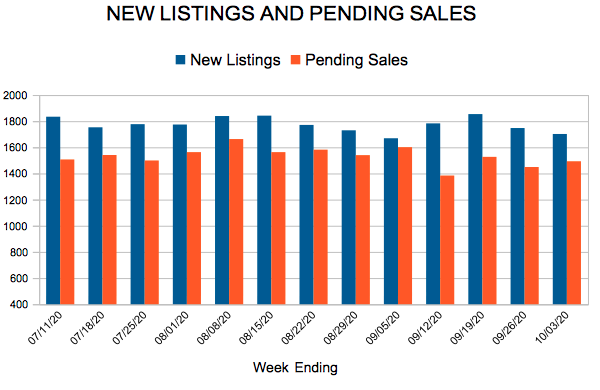
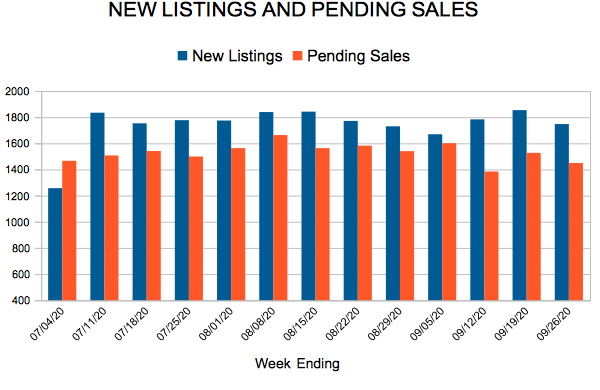
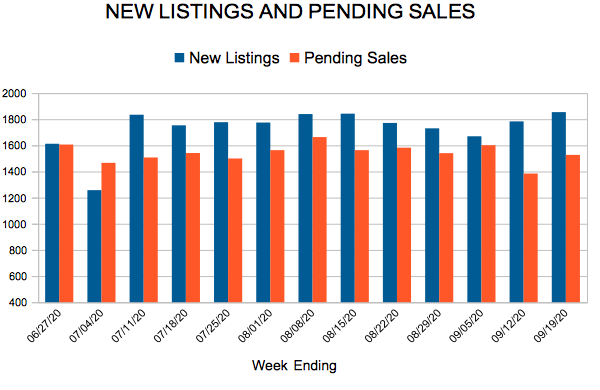
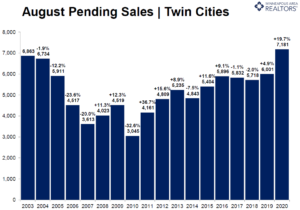
After a 12.0 percent gain in July, the number of signed purchase agreements rose 19.7 percent in August, compared to last year. At 7,181 pending sales, August 2020 had the highest recorded pending sales count for the month, and also the highest for any month of any year going back to June 2004. Although some of the pent-up demand from June and July was shifted into August, recent gains have turned year-to-date pending sales positive—now up 4.3 percent compared to 2019.
“Buyers were truly out in force last month,” according to Linda Rogers, President of Minneapolis Area REALTORS®. “The gains were widespread, with both urban and suburban locations appealing to home buyers.”
Relentless demand and diminished supply have accelerated home price growth. The median sales price in the metro rose 9.8 percent to $315,000. Excluding July of this year, that’s the strongest rate of price growth since March 2018. The median price of a newly built home was around $405,000. Historically low mortgage rates below 3.0 percent can partly offset affordability challenges caused by rising prices.
Despite a modest gain in new listings from last August, buyer demand continued to overwhelm sellers. Multiple offer situations are commonplace, and many sellers are accepting offers above list price. In fact, sellers received, on average, 100.3 percent of their original asking price—matching the 18-year record high from June 2018. A balanced market typically has 5-6 months of supply. At just 1.7 months, sellers are still in the driver’s seat.
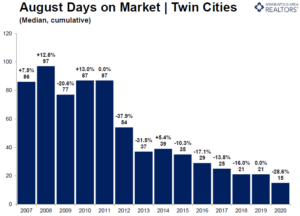
As sales hit a new high, market times reached a new low. Half of the sales occurred in less than 15 days. “People are searching high and low for properties that meet their needs,” said Patrick Ruble, president of the Saint Paul Area Association of REALTORS®. “Attractive rates and a lack of supply means homes won’t last long on the market.”
While an expectation of prolonged tele-commuting has encouraged some to seek more space farther out, it’s notable that Minneapolis and St. Paul saw sales increase 28.1 and 29.2 percent respectively. New listings were also up notably in both cities. Condo sales rose 1.4 percent across the metro but were up 5.6 percent in Minneapolis and down 17.3 percent in St. Paul. The luxury segment has performed quite well recently. Metro-wide sales over $1M surged 51.1 percent from last August.
AUGUST 2020 BY THE NUMBERS COMPARED TO A YEAR AGO
The latest numbers for Twin Cities residential real estate show a stable market with some ongoing signs of transition. Prices are still rising, supply is still tight, and demand has recovered even while market times have lengthened. Even though more buyers are closing on homes, the urgency has subsided somewhat. Days on market rose 2.4 percent from last September, marking the fifth year-over-year increase in the last seven months. Market times remain swift despite modest increases. Sales rose 3.4 percent and the median sales price increased 6.6 percent to $279,250. Pending sales—a measure of signed contracts and future demand—rose 2.9 percent. Both pending and closed sales are down slightly for the year so far, but that may change. New listings were up 2.5 percent, helping some buyers take advantage of historically low rates. Sellers have been accepting a slightly lower share of their list price compared to the year prior for seven of the last eight months—with September bucking that trend. This, along with other indicators, suggests the market is rebalancing in a way that could benefit buyers.
The number of active listings for sale is up over the last 12 months and for most of 2019. Even so, the market remains tight—particularly for first-time buyers and downsizers competing in the under $300,000 segment where multiple offers and homes selling for over list price remain commonplace. Despite the demand, builders struggle to replenish inventory in that undersupplied segment due to high land and material costs combined with a significant labor shortage and tricky regulations. The shortage of affordable homes has led to an increase in remodeling as people are staying in their homes longer. It’s challenging to find comparable home at a similar payment in the desired location. With just 2.5 months of supply, the Twin Cities is still significantly undersupplied.
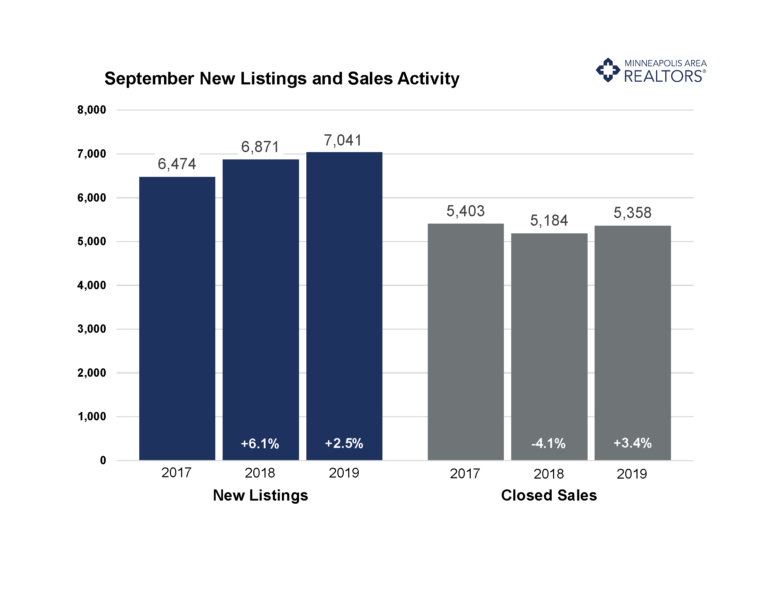
September 2019 by the Numbers (compared to a year ago)
Quotables
“Attractive interest rates have unleashed some of the pent-up demand from earlier this year,” said Todd Urbanski, President of Minneapolis Area REALTORS®. “But each price point, product type and area is unique.”
“Buyers are still very much motivated despite some challenges,” said Linda Rogers, President-Elect of Minneapolis Area REALTORS®. “It really shows the resilience of our region and the value of homeownership.”
From The Skinny Blog.
September 18, 2019
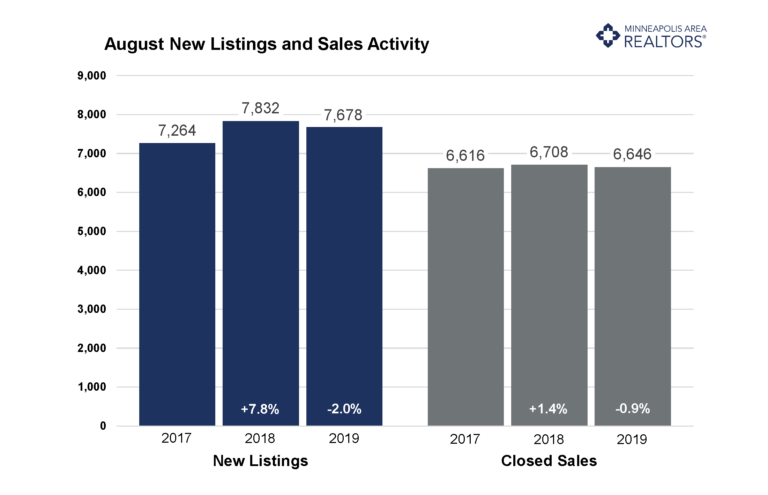
With two-thirds of the year in the books, we’re getting a clearer picture of where the housing market stands. The latest numbers for Twin Cities residential real estate show stability along with signs of deceleration. The median sales price continued to rise, landing at $286,800 for the month. Pending sales—a measure of signed contracts and future demand—rose 3.2 percent but are down slightly for the year so far. New listings slipped 2.0 percent, thwarting some buyers’ hopes of taking advantage of historically low rates. Closed sales were down 0.9 percent for the month and are down 1.4 percent for the year. One sign of market shift is days on market, which rose 2.5 percent year-over-year. Market times remain swift, but that’s the fourth year-over-year increase this year. Another sign of a changing market is the ratio of sold to list price. Sellers have been accepting a slightly lower share of their list price compared to the year prior for seven of the last eight months. This, along with other indicators, suggests the market is rebalancing. The landscape seems to be improving for buyers, even though sellers still have strong pricing power, favorable negotiating leverage and quick market times.
The number of active listings for sale has been rising this year. Even so, the market remains tight—particularly for first-time buyers and downsizers competing in the sub-$300,000 segment where multiple offers and homes selling for over list price are commonplace. With just 2.5 months of supply, the Twin Cities is still significantly undersupplied. The move-up and upper-bracket segments are less competitive and better supplied. Given some of the recent economic uncertainty, it’s worth noting that the Twin Cities market is well-positioned to withstand an economic downturn.
August 2019 by the Numbers (compared to a year ago)
Sellers listed 7,678 properties on the market, a 2.0 percent decrease from last August
Buyers closed on 6,646 homes, a 0.9 percent decrease
Inventory levels decreased 5.5 percent from last August to 12,238 units
Months Supply of Inventory was down 3.8 percent to 2.5 months
The Median Sales Price rose 7.0 percent to $286,800, a record high for August
Cumulative Days on Market rose 2.5 percent to 41 days, on average (median of 21)
Changes in Sales activity varied by market segment
Single family sales rose 1.4 percent; condo sales decreased 6.2 percent; townhome sales fell 7.8 percent
Traditional sales increased 0.1 percent; foreclosure sales dropped 40.9 percent; short sales fell 45.5 percent
Previously owned sales were down 0.1 percent; new construction sales declined 5.0 percent
Quotables
“Some think the fall market isn’t for them, but tight conditions and favorable rates suggest momentum moving into 2020,” said Todd Urbanski, President of Minneapolis Area REALTORS®. “We’re at a moment when sellers are enjoying their position while buyers are taking advantage of lower than expected interest rates and more options.”
“Most markets remain stable across the metro,” said Linda Rogers, President-Elect of Minneapolis Area REALTORS®. “While there is a good amount of local variation, we just don’t see that many signs for concern.”
From The Skinny Blog.


Licensed In Minnesota
All information deemed reliable but not guaranteed and should be independently verified.