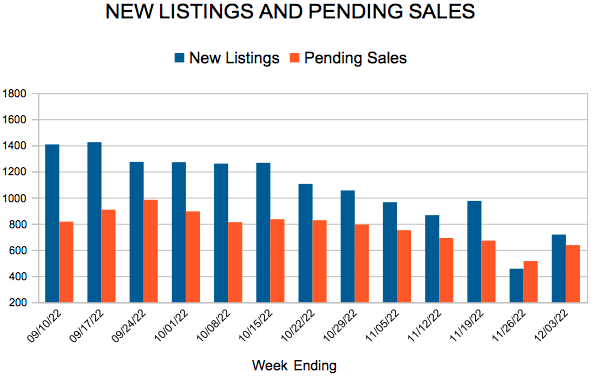
New Listings and Pending Sales
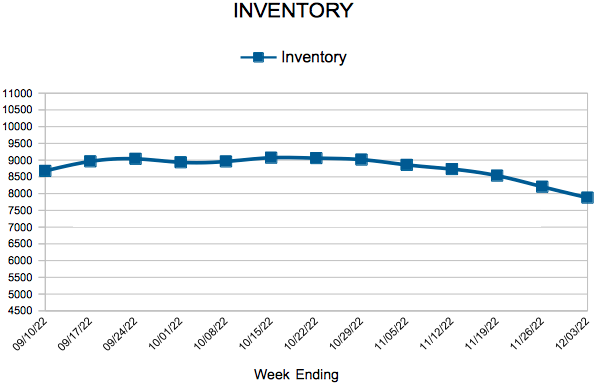
Inventory
Weekly Market Report
 For Week Ending December 10, 2022
Conforming loan limits on mortgages acquired by Fannie Mae and Freddie Mac will increase in most of the United States to $726,200 in 2023, up from $647,200 in 2022, according to the Federal Housing Finance Agency. Meanwhile, the conforming loan limit in high-cost areas will increase to $1,089,300, exceeding the $1 million dollar mark for the first time. The increases in loan limits will allow a larger group of borrowers to qualify for loans backed by Fannie Mae and Freddie Mac.
IN THE TWIN CITIES REGION, FOR THE WEEK ENDING DECEMBER 10:
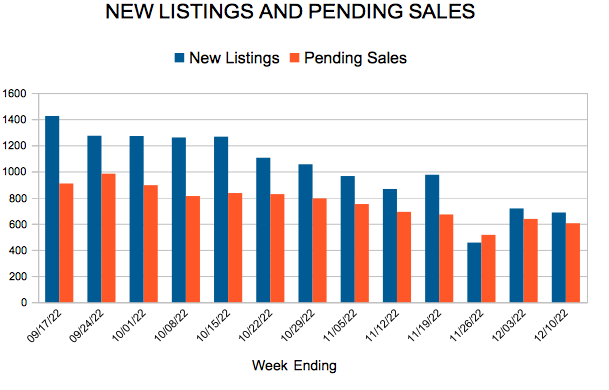
- New Listings decreased 4.1% to 686
- Pending Sales decreased 27.1% to 604
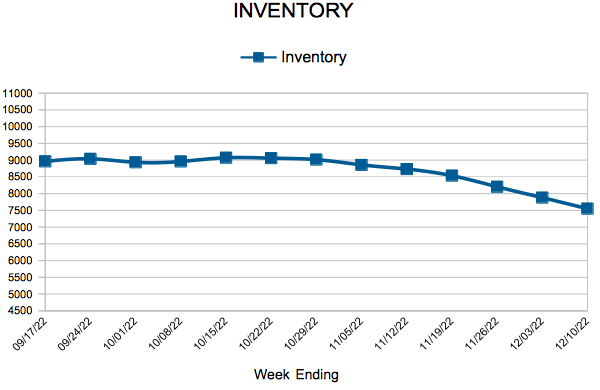
- Inventory increased 15.5% to 7,549
FOR THE MONTH OF NOVEMBER:
- Median Sales Price increased 4.1% to $354,000
- Days on Market increased 33.3% to 40
- Percent of Original List Price Received decreased 2.6% to 97.2%
- Months Supply of Homes For Sale increased 41.7% to 1.7
All comparisons are to 2021
Click here for the full Weekly Market Activity Report. From MAAR Market Data News.
Sales down and inventory up amid slowing price growth
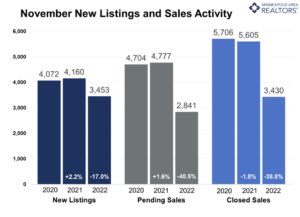
- Buyer activity down 40.5 percent with 2,841 pending sales
- Median sales price of Twin Cities homes rose 4.1 percent to $354,000
- Sellers continued to hesitate, with 17.0 percent fewer new listings in November
(December 15, 2022) – According to new data from Minneapolis Area REALTORS® and the Saint Paul Area Association of REALTORS®, the metro saw its largest drop in year over year home sales this November, largely due to increased mortgage interest rates combined with unprecedented buyer activity in the fourth quarter of 2021.
SALES & LISTINGS
Real estate activity has cooled across the United States after a series of significant rate hikes by the Federal Reserve designed to slow borrowing in an effort to combat rising inflation. For residential real estate, that’s meant higher mortgage rates and monthly payments, which can push homeownership further out of reach for some buyers. Last month, buyers signed 2,841 purchase agreements, a staggering 40.5 percent fewer than last year and the lowest November figure in over a decade. Only 3,430 transactions closed, down 38.8 percent, which meant sellers had to be more flexible.
“Sellers are hesitant to put their home on the market because their payments would be very different,” according to Denise Mazone, President of Minneapolis Area REALTORS®. “In most cases, sellers are also then buyers, and many have chosen to stay put for now until things settle down, instead of trading up to a higher payment on a more expensive home.”
There were 3,453 homes listed in November, 17.0 percent fewer listings than November 2021. Sellers should understand that—unlike last year—they may not receive dozens of offers above asking price within hours or days of listing. Last month, half of all sellers sold homes for no more than 98.4 percent of their original listing price compared to 99.8 percent last year. Additionally, they accepted those offers after an average of 40 days on market. It’s not just the higher costs on the next home that’s concerning today’s sellers; they will need to be more patient, be willing to accept a bit less than asking price, and be prepared to sweeten the deal and/or possibly help cover some closings costs—very different dynamics than a year ago.
INVENTORY & HOME PRICES
The median home price in the Twin Cities increased by 4.1 percent to $354,000. Compared to a couple months with 10.0 percent year-over-year price growth in 2022, this moderate increase is more aligned with the historic average in the Twin Cities. While price growth is slowing, the overall direction of home prices has been positive throughout the year.
“One factor that’s kept home prices rising modestly is that seller activity has come down in tandem with sales,” said Mark Mason, President of the Saint Paul Area Association of REALTORS®. “Moderating price growth should be seen as a sign of a more sustainable market in line with longer-term trends.”
The softening in buyer activity meant 12.6 percent more homes remained on the market at month-end, closing out November with 7,629 units in inventory. Yet more supply is still needed. The metro only has 1.7 month’s supply of inventory. Typically 4-6 months of supply are needed to reach a balanced market.
LOCATION & PROPERTY TYPE
Market activity varies by area, price point and property type. New home sales fell 18.7 percent while existing home sales were down 40.2 percent. Single family sales fell 39.2 percent, condo sales declined 30.9 percent and townhome sales were down 35.3 percent. Sales in Minneapolis decreased 34.4 percent while Saint Paul sales fell 37.9 percent. Cities like Hutchinson, Medina, and Little Canada saw the largest sales gains while Savage, Monticello and Roseville all had notably lower demand than last year.
NOVEMBER 2022 HOUSING TAKEAWAYS (COMPARED TO A YEAR AGO)
- Sellers listed 3,453 properties on the market, a 17.0 percent decrease from last November
- Buyers signed 2,841 purchase agreements, down 40.5 percent (3,430 closed sales, down 38.8 percent)
- Inventory levels grew 12.6 percent to 7,629 units
- Month’s Supply of Inventory rose 41.7 percent to 1.7 months (4-6 months is balanced)
- The Median Sales Price rose 4.1 percent to $354,000
- Days on Market rose 33.3 percent to 40 days, on average (median of 24 days, up 50.0 percent)
- Changes in Sales activity varied by market segment
- Single family sales decreased 39.2 percent; Condo sales were down 30.9 percent & townhouse sales fell 35.3 percent
- Traditional sales declined 38.5 percent; foreclosure sales rose 40.0 percent; short sales rose 150.0 percent (2 to 5 units)
- Previously owned sales decreased 40.2 percent; new construction sales declined 18.7 percent
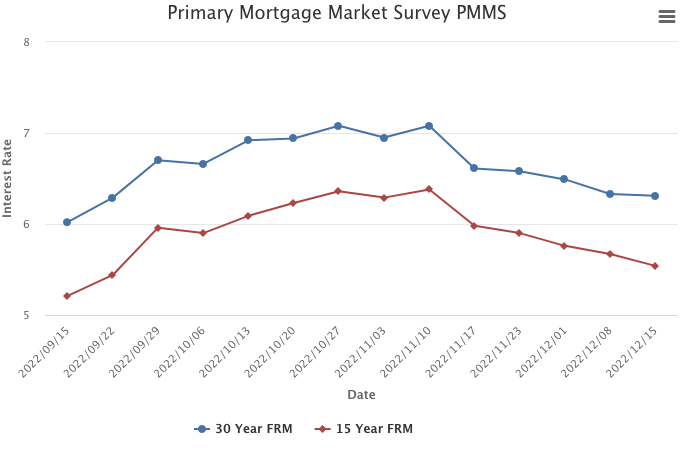
Mortgage Rates Continue their Downward Trajectory
December 15, 2022
Mortgage rates continued their downward trajectory this week, as softer inflation data and a modest shift in the Federal Reserve’s monetary policy reverberated through the economy. The good news for the housing market is that recent declines in rates have led to a stabilization in purchase demand. The bad news is that demand remains very weak in the face of affordability hurdles that are still quite high.
Information provided by Freddie Mac.
New Listings and Pending Sales
Inventory
Weekly Market Report
 For Week Ending December 3, 2022
Rising interest rates and higher sales prices have caused affordability to decline significantly this year, and U.S. homebuilders have taken note. New homes have been getting smaller throughout 2022, with the U.S. Census reporting the median square footage of homes under construction was 2,276 in the third quarter of 2022, down 2.5% from the fourth quarter of 2021, when the median square footage was 2,335. The trend toward smaller homes is expected to continue in the months ahead, as homebuyer budgets remain constrained.
IN THE TWIN CITIES REGION, FOR THE WEEK ENDING DECEMBER 3:
- New Listings decreased 18.8% to 717
- Pending Sales decreased 34.3% to 637
- Inventory increased 14.4% to 7,879
FOR THE MONTH OF OCTOBER:
- Median Sales Price increased 4.6% to $355,500
- Days on Market increased 33.3% to 36
- Percent of Original List Price Received decreased 2.0% to 98.3%
- Months Supply of Homes For Sale increased 33.3% to 2.0
All comparisons are to 2021
Click here for the full Weekly Market Activity Report. From MAAR Market Data News.
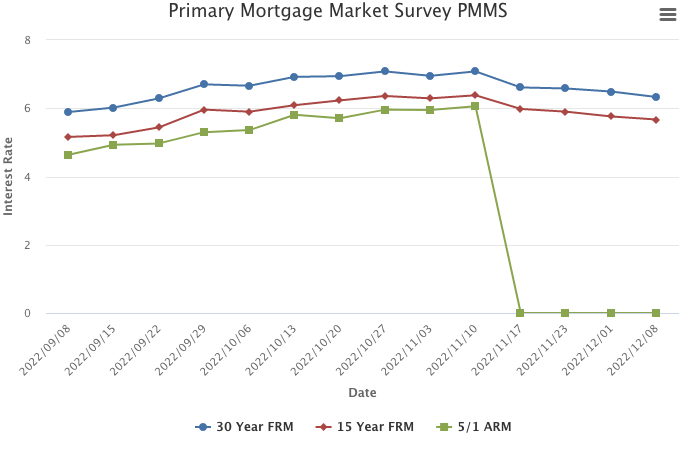
Mortgage Rates Continue to Drop
December 8, 2022
Mortgage rates decreased for the fourth consecutive week, due to increasing concerns over lackluster economic growth. Over the last four weeks, mortgage rates have declined three quarters of a point, the largest decline since 2008. While the decline in rates has been large, homebuyer sentiment remains low with no major positive reaction in purchase demand to these lower rates.
Information provided by Freddie Mac.
- « Previous Page
- 1
- …
- 69
- 70
- 71
- 72
- 73
- …
- 106
- Next Page »

